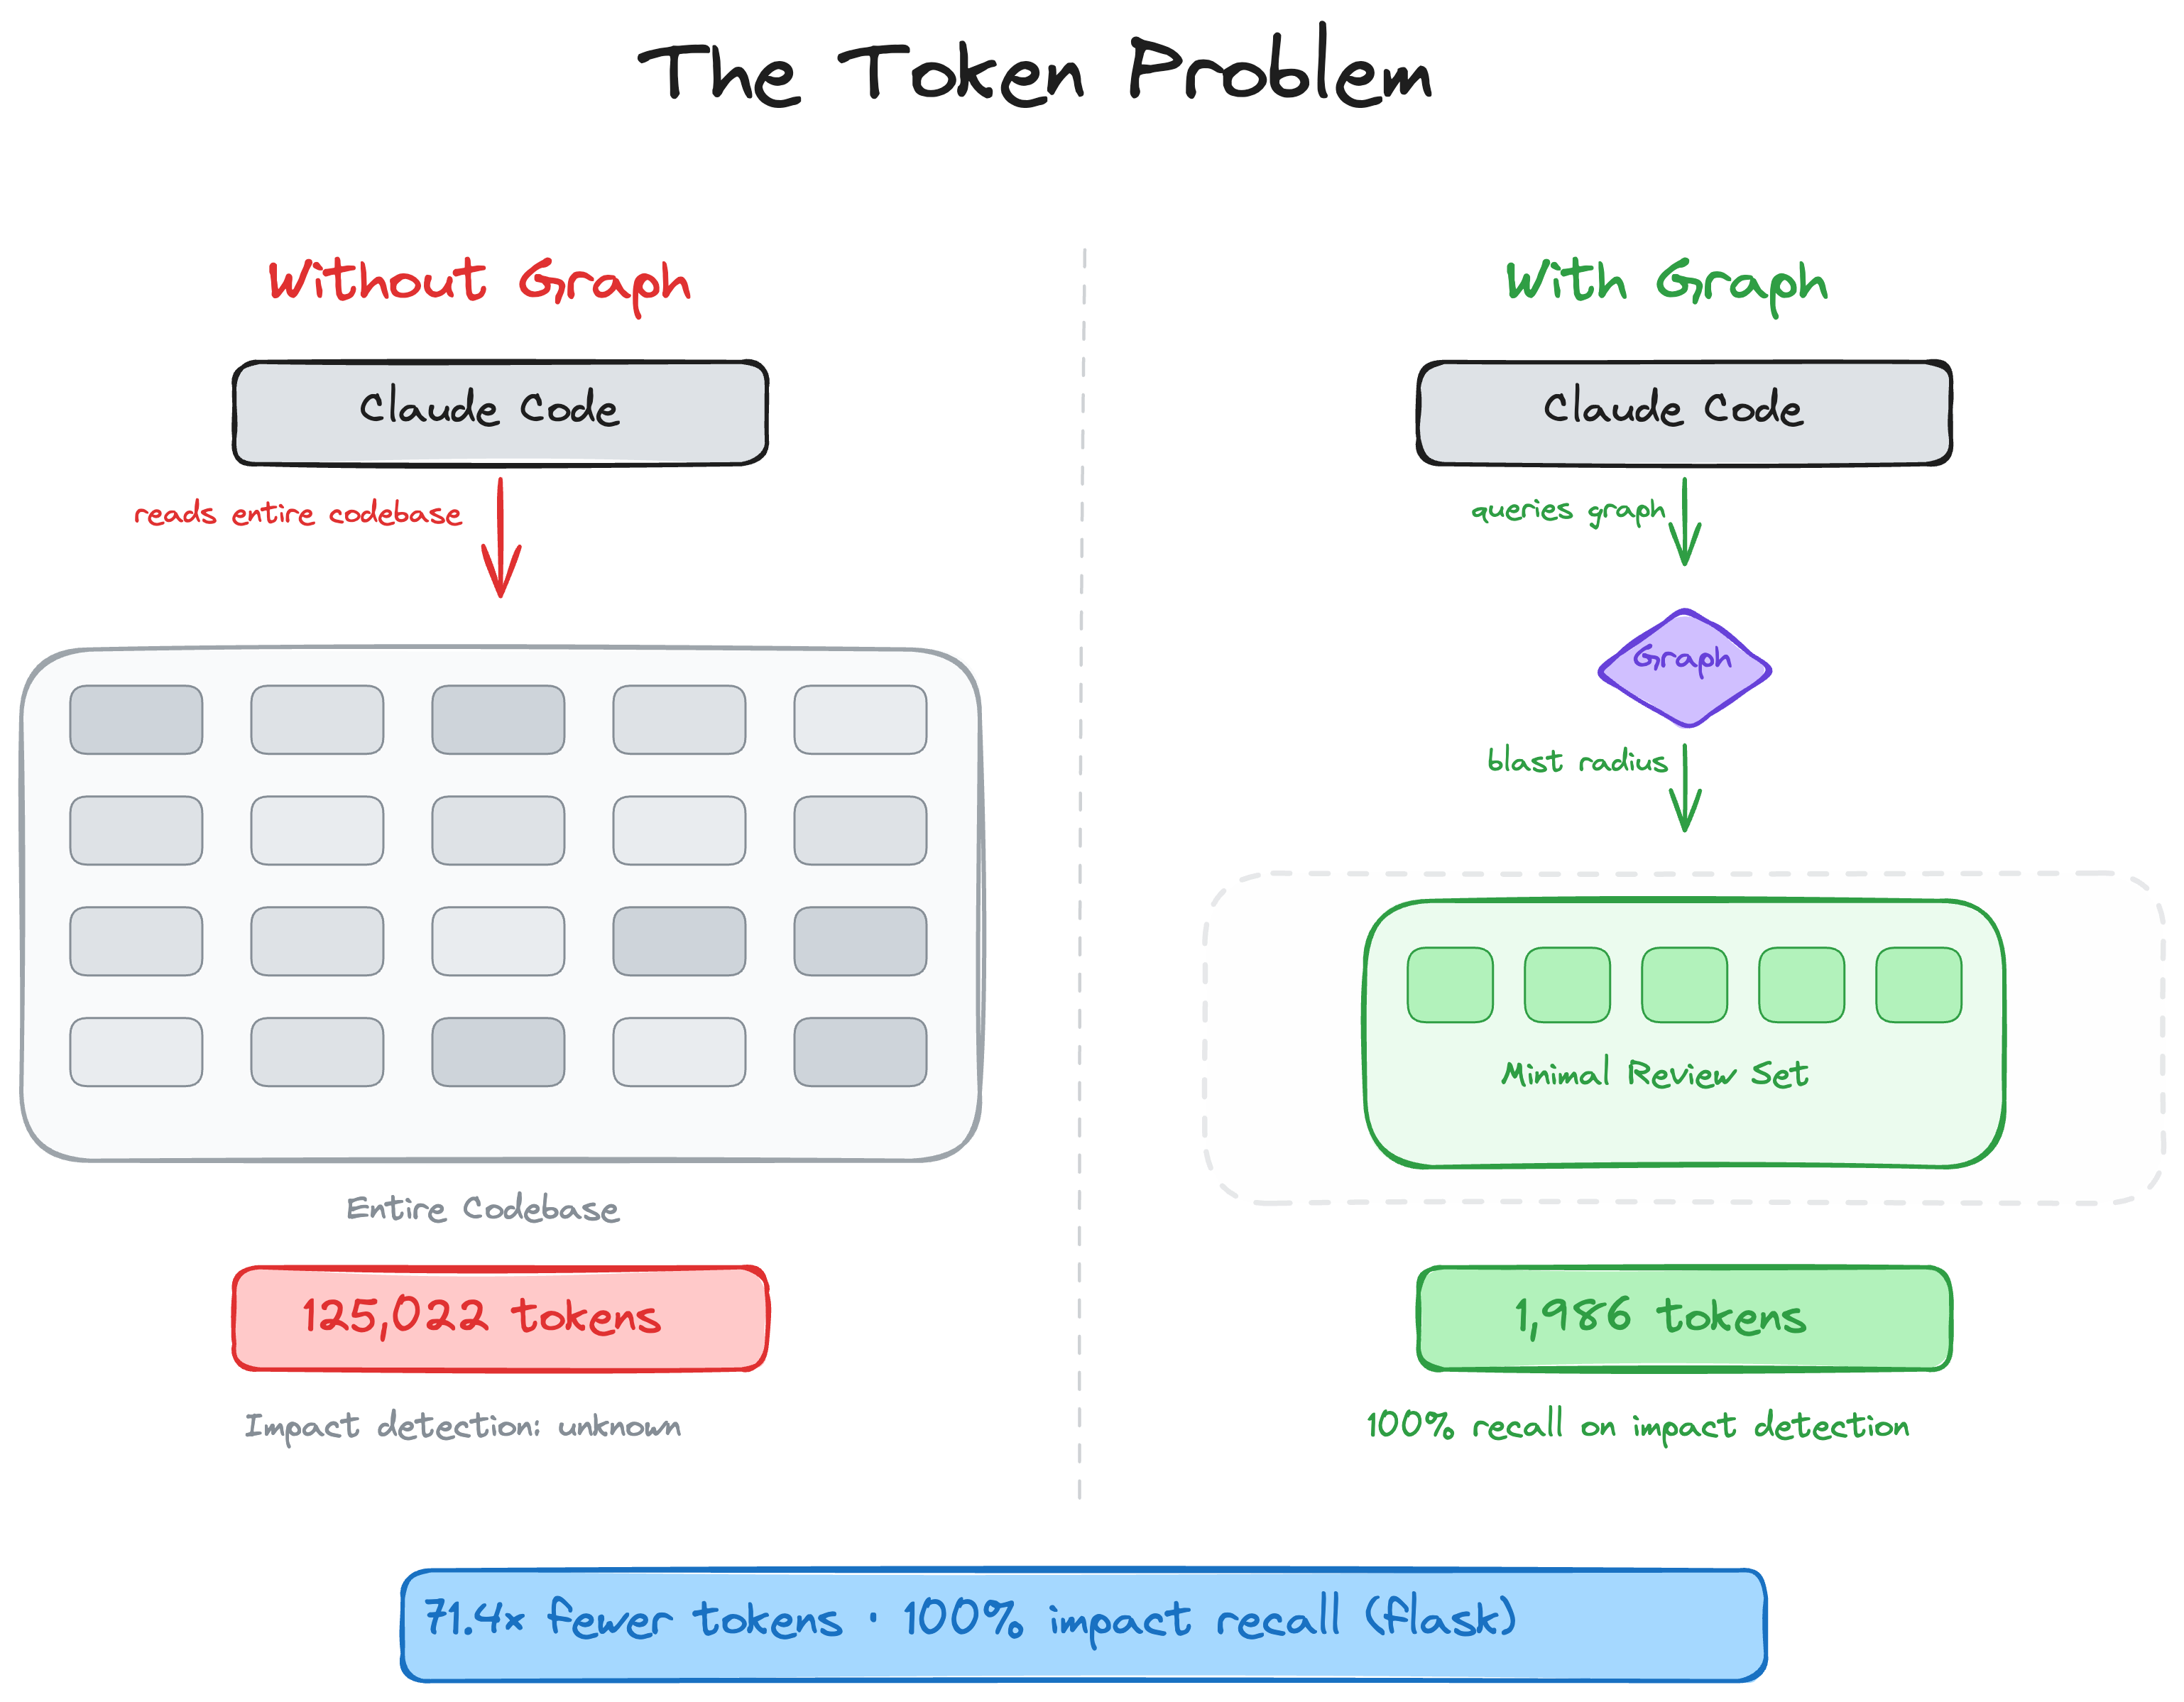
Diagram from code-review-graph, commit 6a1ee1c · MIT licensed · kept locally so this post does not depend on a hotlink.
I saw code-review-graph climbing GitHub Trending and nearly wrote the usual post about why AI coding needs better context. Then I stopped. That sentence is true, but it is also a pretty easy way to avoid trying the tool.
So I did a small smoke test first.
I ran it inside a Docker container, not on the host. The container had one CPU and 1.5 GiB of memory. Inside it, I made a tiny Python repository: authentication, a login endpoint, and one test. Then I installed code-review-graph 2.3.7 and built the graph.
Full build: 3 files, 6 nodes, 9 edges
Nodes: 6
Edges: 9
Files: 3
Languages: python
Nothing dramatic happened, which was reassuring. The tool connected api.py, auth.py, and the test in the way I expected. That only proves it can build a graph for a tiny repository. It does not prove that it will make pull request reviews better on a real codebase. Still, the smallest claim held up without giving the tool access to the machine running the blog.
What the tool is trying to do
code-review-graph uses Tree-sitter to map a repository. The intended payoff is simple: when an agent reviews a change, it should not need to read an entire repository just to find the few files that matter.
That sounds obvious until a change touches an API, a worker, a deployment chart, and an alert rule. At that point the problem is not a lack of context window. It is finding the context that is actually connected to the change.
For a three-file repository, I would still open the files myself. There is no prize for adding a graph database to a problem that rg can solve in ten seconds. The case gets more interesting once the repository is large enough that a change has consequences outside the diff.
About the 528x number
The project README leads with an eye-catching result: up to 528x fewer tokens. That number is real, but it is the best case from the project's FastAPI benchmark.
The more useful number is their reported median of roughly 82x per question across six repositories. Even that needs context. The comparison is whole-corpus reading versus a graph query. A good engineer does not normally paste an entire repository into an LLM and hope for the best, so this is an upper-bound baseline, not a normal day at work.
I like that the README says as much. Too many AI tool pages put the caveat in a footnote, if they include one at all.
What I liked
The project does not try to make the model magically smarter. It tries to give the model less irrelevant material. That is a healthier problem to work on.
It also has a plausible route into real workflows: a CLI, MCP support, incremental updates, and a GitHub Action. A graph that looks good in a demo is easy. Keeping one useful after a repository changes every day is the hard part.
What I still do not know
This smoke test was deliberately small. It did not answer the questions I would ask before adopting it on a serious repository:
- How long does the first build take on a monorepo?
- How large does the graph database become?
- Does retrieval surface the files an experienced reviewer would open anyway?
- Does it save time, or does it add another moving part to maintain?
I would not give a trending tool write access to a repository on the strength of a screenshot and a benchmark chart. A read-only container, a non-critical repository, and outputs that a human can inspect are enough for a first pass.
If you want to try it
Start with one repository you know well. Measure the first build and an incremental update. Then compare the suggested files with the files you would have opened during a normal review.
If the answers line up, keep going. If they do not, you have still learned something useful and avoided adding another MCP server just because it was trending.
Test notes: code-review-graph 2.3.7 ran in an isolated Docker container with Python 3.12, one CPU, and 1.5 GiB of memory. This was a graph-build smoke test on a small Python repository. I did not independently reproduce the project's token benchmark.
Sources: code-review-graph · benchmark methodology · GitHub Trending